
Create a Histogram Breakdown
- Open the graph created in Create a Graph and Add a Plot to a Graph.
- Expand the downward arrow under the center of the graph.
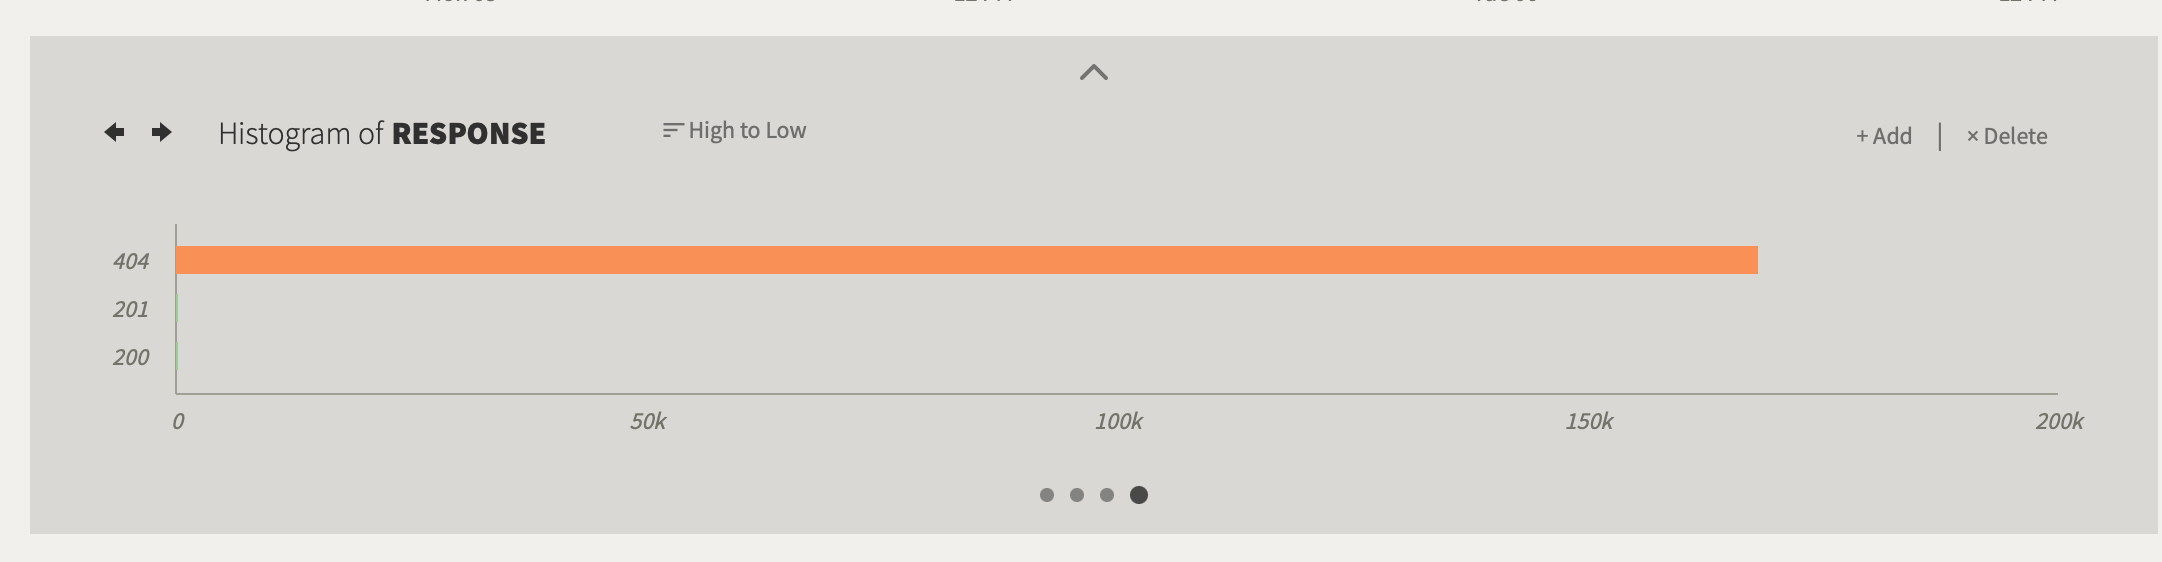
- Select a breakdown type of Histogram.
- Set field name to Response.
- Click the Add Breakdown button.
Each graph can have five breakdowns.
Pie Chart Breakdown
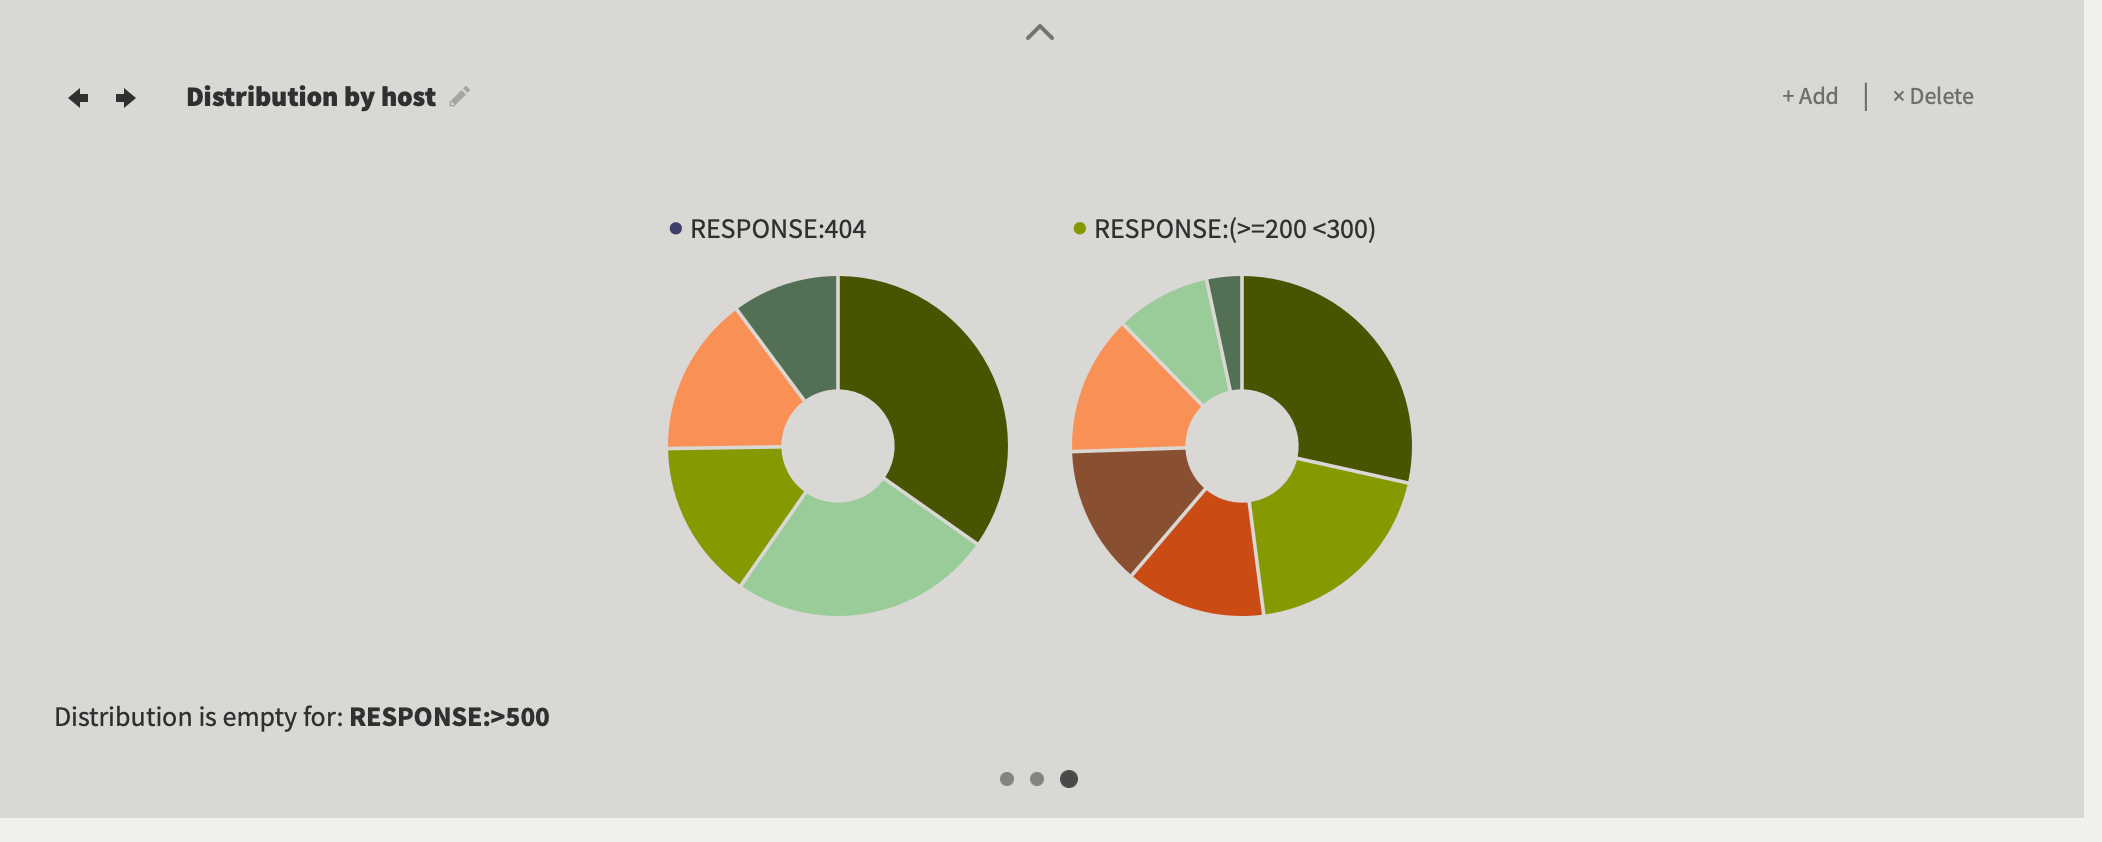
With a pie chart breakdown, you can see how the response codes are distributed across hosts.- Click +Add.
- Select breakdown type Pie.
- Distribute by Fields.
- Set field to Host.